# Best Logging Solution for Docker [Basic Version]
Logs are important, right? While debugging something, It helps us more than anything.
Generally, we use commands to check logs of each container, for example,
`docker logs -f container_1`
and it is fine for a few containers, but suppose, you have a complex architecture, where you are using [Docker Swarm](https://docs.docker.com/engine/swarm/) or [Docker-Compose](https://docs.docker.com/compose/) or just assume you have a number of containers, then what?
Yes! It will be a real pain to maintain those logs, on top of that, other issues like No sharing of logs with the team, No Access-based control, etc. will also be there.
I bet the native Docker plugin kinda feeling similar as below right now :
Let's try a solution for that :)
We will be using Loki and Grafana to achieve our goal. Loki is a set of components that can be composed into a fully-featured logging stack. More info [here](https://github.com/candlerb/loki/blob/a2d1aba305299db2aa5747e227026277a591f6d7/docs/overview/README.md) and [here](https://github.com/candlerb/loki/blob/a2d1aba305299db2aa5747e227026277a591f6d7/docs/architecture.md)
---
Before we jump into installation and all other intense stuff, let's see what benefits are we going to get by end of this installation:
1. Restricted User Access
1. Organization Support
2. Log Rotation
3. Centralisation of logs
4. Visualize various logs in a single place using Loki Queries.
5. Live Tailing of logs
---
Let's start the setup:
1. Configuring the Logging Driver for Docker
2. Setting up the Loki instance with its config file
3. Setting up Grafana Dashboard to visualize the logs.
### 1. Configuring the Logging Driver for Docker
**you need to repeat these steps for each Docker node if you are using Docker Swarm*
#### - Install the driver
```
docker plugin install grafana/loki-docker-driver:latest --alias loki --grant-all-permissions
```
#### - Configure the Docker to send logs to Loki Instance
```
{
"debug" : false,
"log-driver": "loki",
"log-opts": {
"loki-url": "http://127.0.0.1:3100/loki/api/v1/push"
}
}
```
#### - Restart the Docker Daemon on each node
```
# Check the number of the nodes in your swarm
docker node ls
# Drain the node so the running workload can be shifted to other nodes.
docker node update --availability drain node1_name
# Restart the docker daemon on that node
systemctl restart docker
# Make the node active again
docker node update --availability active node1_name
```
### 2. Setting up the Loki instance with its config file
To get the codebase, Clone my [fork](https://github.com/k4kratik/loki)
```
git clone https://github.com/k4kratik/loki
```
#### - Observe the config file `loki-local-config.yaml`
```
auth_enabled: false
server:
http_listen_port: 3100
ingester:
lifecycler:
address: 127.0.0.1
ring:
kvstore:
store: inmemory
replication_factor: 1
chunk_idle_period: 15m
schema_config:
configs:
- from: 2019-06-01
store: boltdb
object_store: filesystem
schema: v9
index:
prefix: index_
period: 168h
table_manager:
.
.
.
# Notice this
retention_deletes_enabled: true
retention_period: 672h
...
```
Here we are setting up the auto-deletion of old logs after a certain period, which is 28 days (672 Hours) in our case.
#### - Now Install the stack
```
docker stack deploy -c docker-compose.yml loki-stack
```
#### - Verify that everything is working fine.
```
docker service ls
```
### 3. Setting up Grafana Dashboard to visualize the logs.
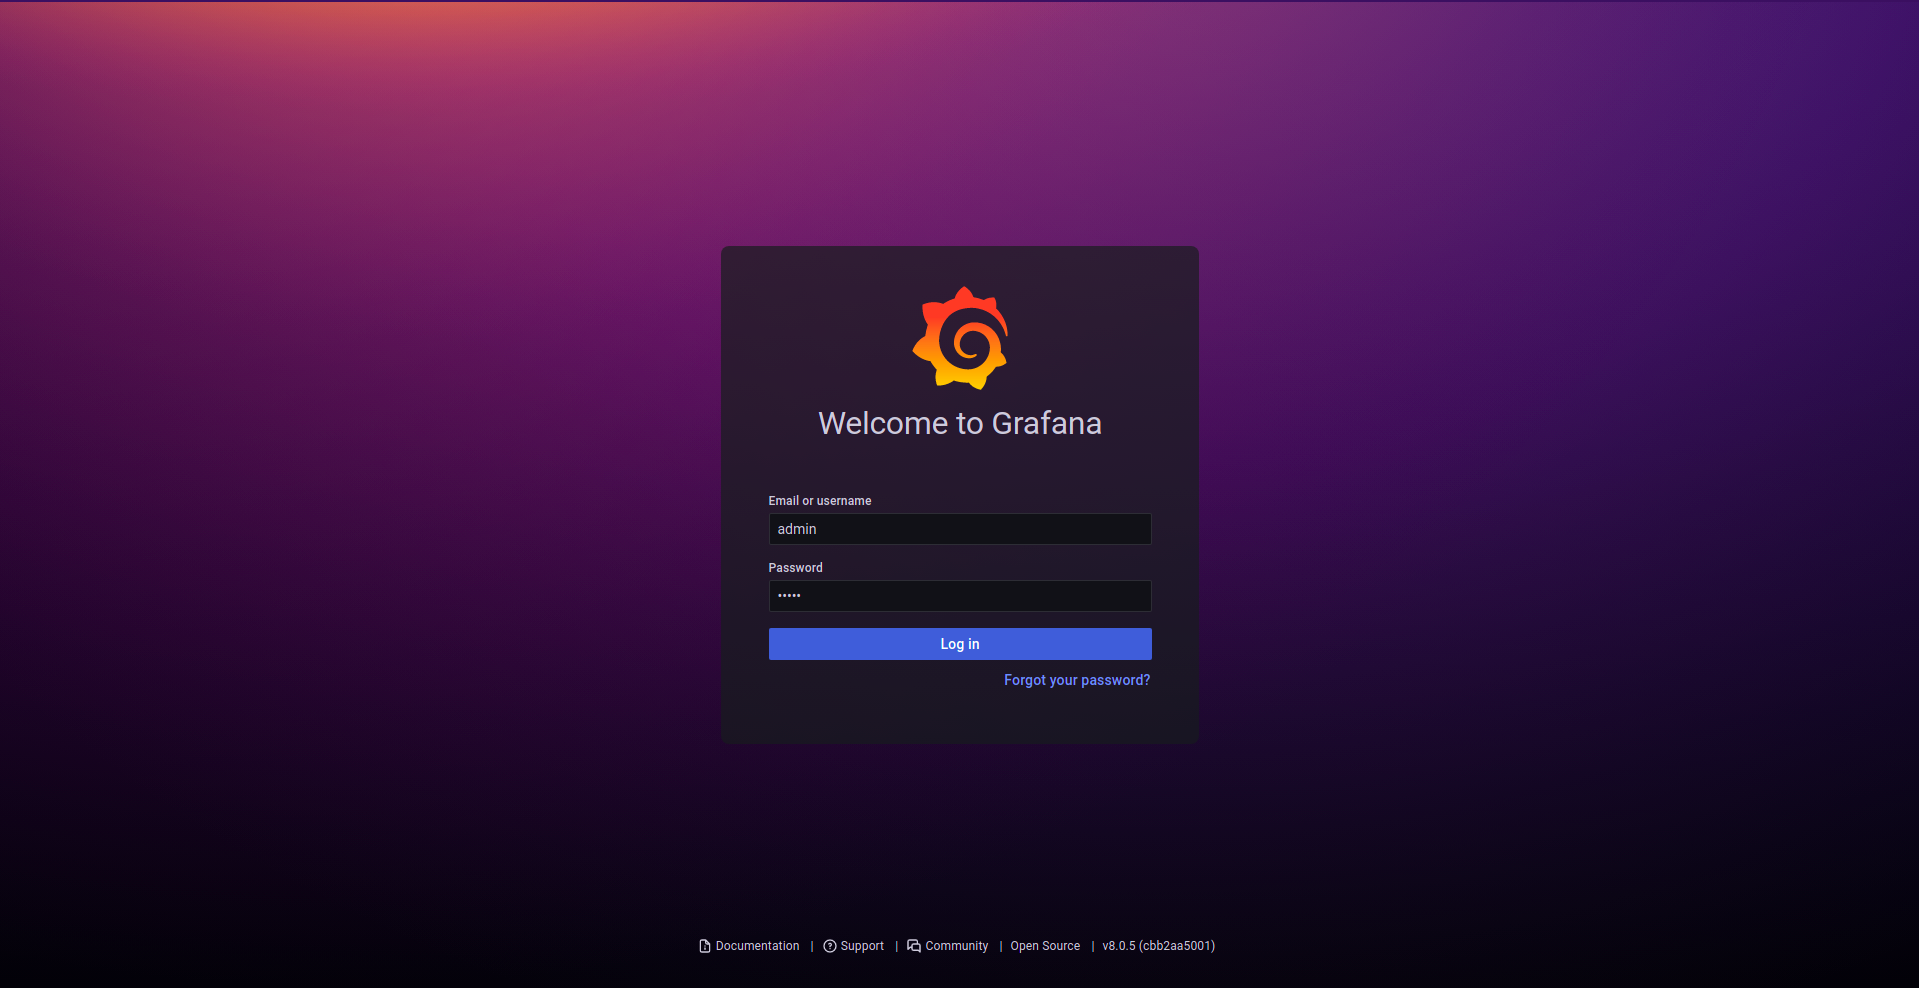
above stack file also contains a grafana instance, which will be available to `YOUR_SERVER_IP:3000`
Go to Grafana Dashboard, Initial credentials will be `admin:admin`
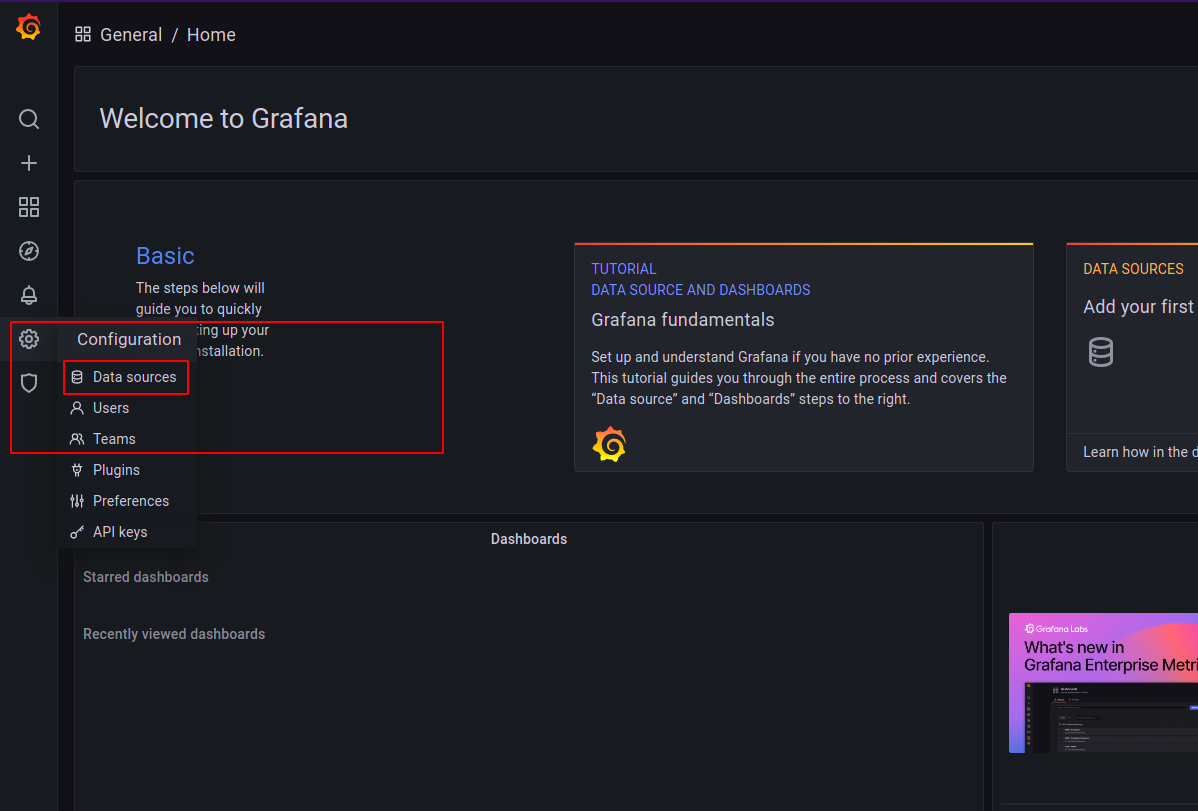
Go to `Configuration` > `Data Sources` as displayed in the picture.
Now Click on `Add Data Source` and enter the `URL` as `http://loki:3100`
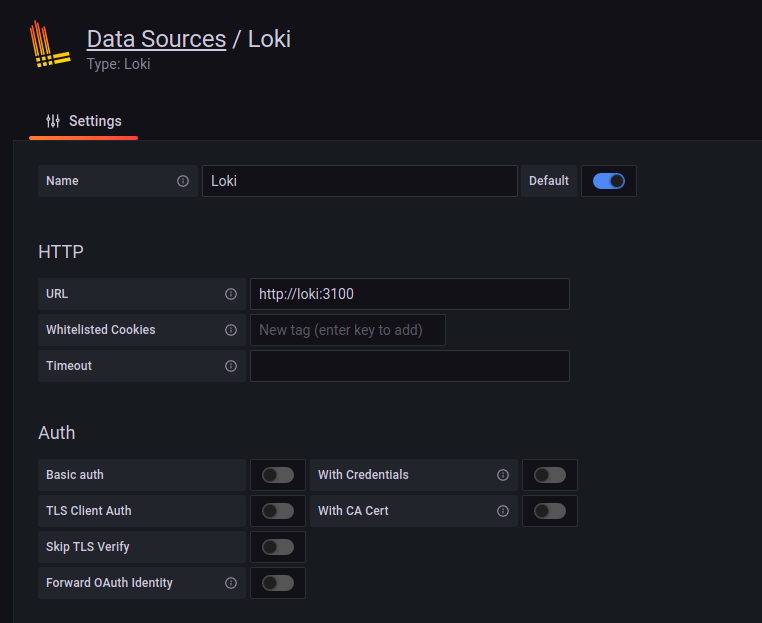
If you have done everything correctly till this point, Clicking `Save & Test` will emit a success message.
❓ Just one question out of curiosity... We did not enter a IP or Domain Name, then How did it figure out our Loki instance correctly ? 🤔
**The answer is :** Check the docker-compose file, the loki service is named as `loki`, and other containers can reach to this container by the service name, which is in our case is **loki**.
> Every container has by default a nameserver entry in /etc/resolve.conf, so it is not required to specify the address of the nameserver from within the container. That is why you can find your service from within the network with **service** or task_service_n.
\- [A stack**overflow** answer](https://stackoverflow.com/a/64867075)
---
#### Using Grafana
Once you have added the Data Source, Go to Explore as instructed below:
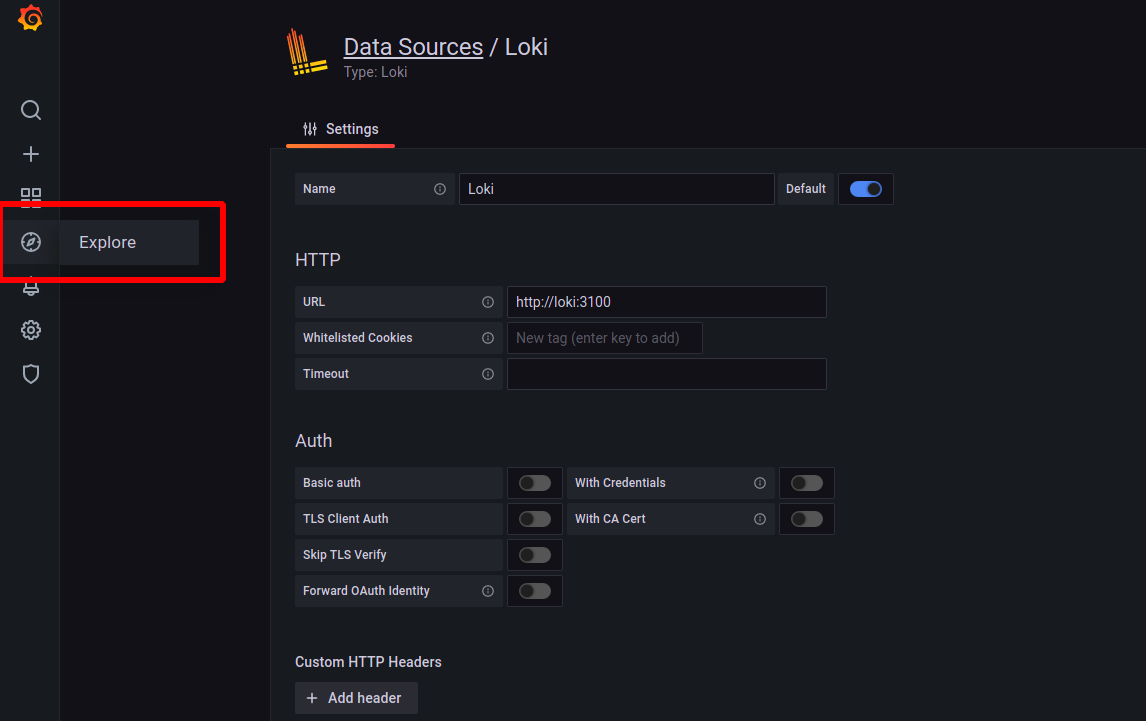
Select a container to view its logs
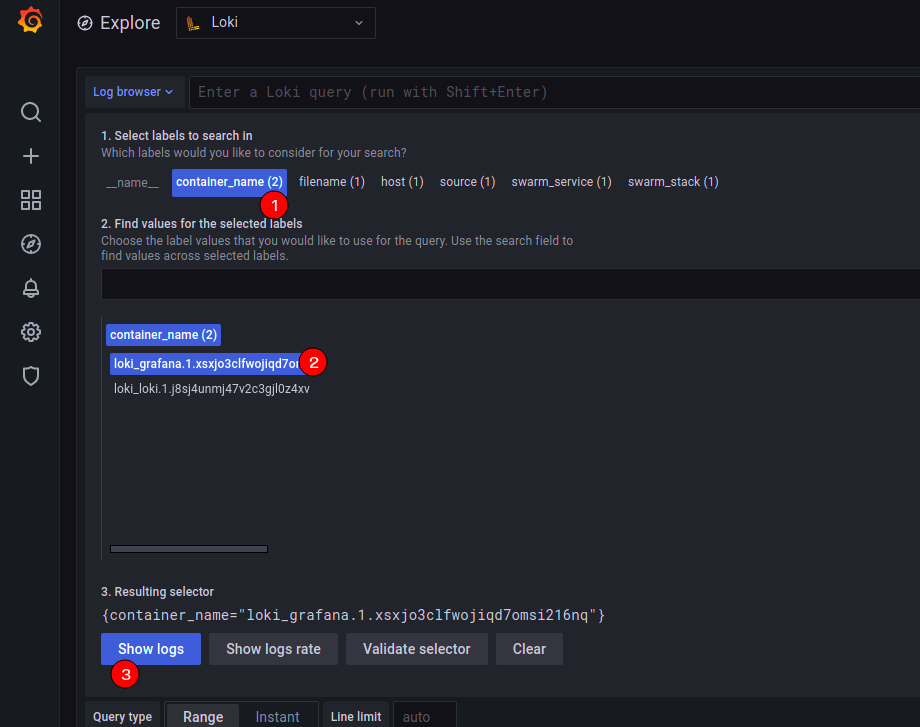
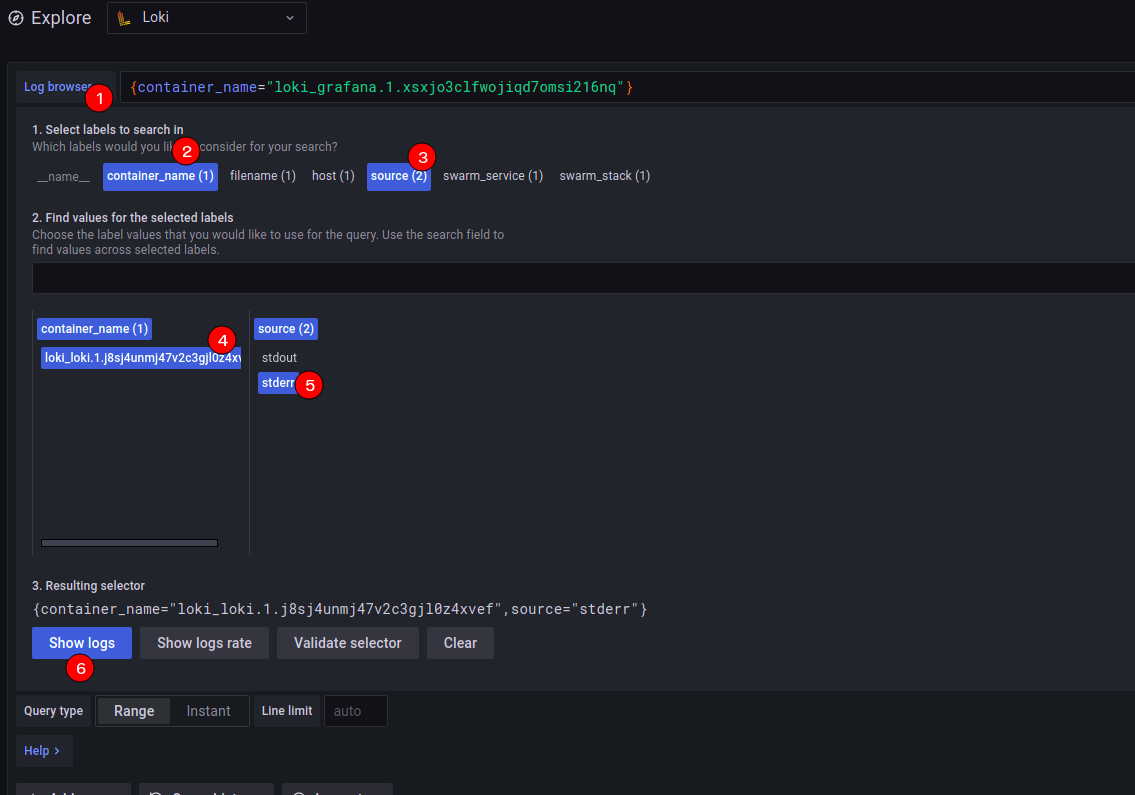
Just like the image below, you can check logs of host, stdout & stderr streams, containers, Docker services, Docker stacks, etc. You can also combine multiple filter to get a consolidated output of your choice.
---
#### Security Measures
1. Block the internet access on Loki port 3100 (+ Grafana Port 3000 if you want). Using Firewall is heavily recommended. As the official [docs](https://grafana.com/docs/loki/latest/operations/authentication/) says, **Loki does not come with any included authentication layer**, So it would be good if you allow only specific IPs.
2. If you want to make it more secure, set up an NGINX reverse proxy with Basic Auth. [For Production Environments]
---
#### Making it more Fault-Tolerant and HA
If you want to take this on a whole next level, well, there is good news for you, for the storage part you can also use Cloud DBs like **DynamoDB** for index and **S3** for storing chunks. You can read storage options [here](https://grafana.com/docs/loki/latest/operations/storage/).
---
My excited Indian ass dances like this whenever I complete any setup :) We all love that feeling, don't we?
Anyways, Thanks for reading and bearing all my content and The Office GIFs!
Hope you got some knowledge from this blog, I am just writing what I am thinking, still trying to making it as simple and straightforward as possible.
[Wanna buy me a Coffee](https://www.buymeacoffee.com/kratik) ☕ ?
[](https://www.buymeacoffee.com/kratik)